


- General Questions
- Error 403 - access error
- Error 404 - access error
- Connecting via FTP using FileZilla
- Connecting via FTP using Total Commander
- Transferring WordPress to another domain
- Tracing route (tracert)
- Protecting Your WordPress website from bot attacks (brute force)
- How to add a domain to Your VPS
- How to change your password in the control panel
- Finding viruses and vulnerabilities on the website
- How to create and launch a Telegram bot
- Password reset
- cPanel
- How to log in to the control panel cPanel
- NGINX Caching disable / clear
- Export Database
- Import Database
- Creating a MySQL database, cPanel control panel
- Setting permissions on files and folders
- Occupied disk space
- Main domain
- Additional domain in cPanel
- How to add a subdomain (subdomain)
- Managing domain records
- Database connection error
- File manager, upload
- File manager, copying
- File manager, moving
- File manager, configuring hidden files display
- File manager, archiving and unarchiving
- Setting a password on a folder
- Change php version
- Installing SSL certificate in cPanel
- Creating a mailbox
- Viewing site logs
- ISPmanager
- How to log in to the control panel ISPmanager
- Technical domain
- Mail domain
- Mailbox
- Automatic installation of CMS (Softaculous)
- Installing SSL certificate Let’s Encrypt
- Installing an existing SSL certificate
- Redirecting to HTTPS://
- Restoring from a backup
- Creating a new DB
- Logging into phpMyAdmin and working with DB
- How to import a DB in ISPmanager
- How to export a DB in ISPmanager
- How to repair DB tables through phpMyAdmin
- Change PHP version
- How to change post_max_size in ISPmanager
- How to change upload_max_filesize in ISPmanager
- How to change max_execution_time in ISPmanager
- File manager - unarchiving
- File manager - creating a zip archive

- Copying and moving files
- Add a new domain (website) to the hosting
- How to add a subdomain
- Mail setup (SPF, DKIM, DMARC)
- Setting up mail via SMTP for WordPress
- How to add a domain to Your VPS
- How to change a domain record (A, MX, TXT)
- Add a new domain (website) to VDS
- How to log in as root in ISPmanager (Admin)
- Connecting additional PHP modules (Admin)
- Installing additional PHP versions (Admin)
- Rebooting the server through the panel (Admin)
- Enabling HTTP/2 support (Admin)
- How to set up backup in ISPmanager (Admin)
- Viewing site logs
- Connection CloudFlare
- FASTPANEL
- BrainyCP
- How the administrator logs into the user's account (Admin panel)
- Creating a new user (Admin panel)
- How to add a domain to Your VPS
- Installing additional PHP versions (Admin panel)
- Deleting and connecting PHP extensions (Admin panel)
- Setting up backup (Admin panel)
- Information about disk usage (Admin panel)
- Rebooting the server from the panel (Admin panel)
- Change the PHP version
- How to upload files via the file manager
- Installing a free Let’s Encrypt certificate
- Installing an SSL certificate
- Automatic installation of CMS
- Creating a DB
- Add a new domain
- Creating a mailbox
- Mail setup (SPF, DKIM, DMARC)
- CMS WordPress
- How to create a new WordPress site
- Creating a WordPress site on a test domain
- How to log into the visual editor of WordPress
- How to add a new page and work in the visual editor
- How to set the homepage in WordPress
- How to set up the menu in the site header
- How to change the logo in the site header
- How to create your own site header
- How to create your own site footer
- Creating and setting up a Gallery page
- How to create a site in multiple languages
- How to place a 360 panoramic image
- How to create a portfolio section
- How to disable unnecessary social media icons
- How to create a contacts page
- How to move your WordPress site
- Reset the admin password
- CMS Moodle
- Installing CMS Moodle
- Creating categories and a Moodle course
- Managing resources and sections in Moodle
- Adding a Web Page element
- Adding files or folders in Moodle
- Adding a Book resource in Moodle
- Lecture in Moodle
- Adding a page to a lecture
- Adding test questions to a lecture
- Creating a Test learning element in Moodle
- VPS/VDS
Checking VPS/VDS Server Load
 › VPS/VDS › Checking VPS/VDS Server Load
If your website is running slowly, it may be due to an increased server load.
The cause could be insufficient server resources allocated to your website or a potential attack on your site.
We will investigate and troubleshoot the cause of the increased load.
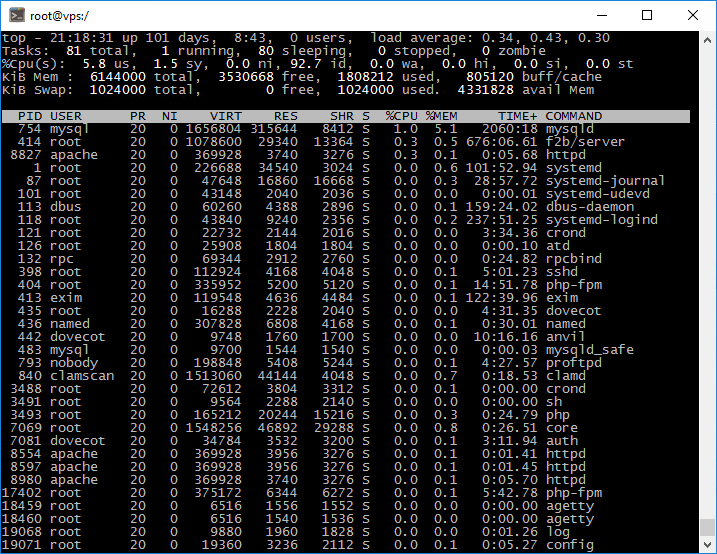
Using the «top» Command to Analyze Server Load
The «top» command is a primary tool for monitoring real-time server performance.
2. Once connected, type the command «top» and press Enter.
The program will display all running processes on your server in real time, allowing you to monitor server load and identify any resource-intensive processes.
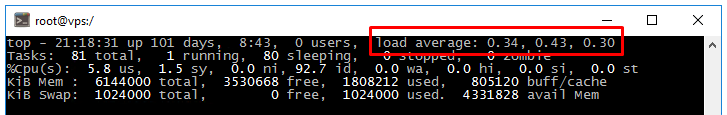
The average system load over a period of time is referred to as Load Average (LA).
It consists of three values representing the average load over the past 1, 5, and 15 minutes.
There are many conflicting opinions on what constitutes a «normal» load value.
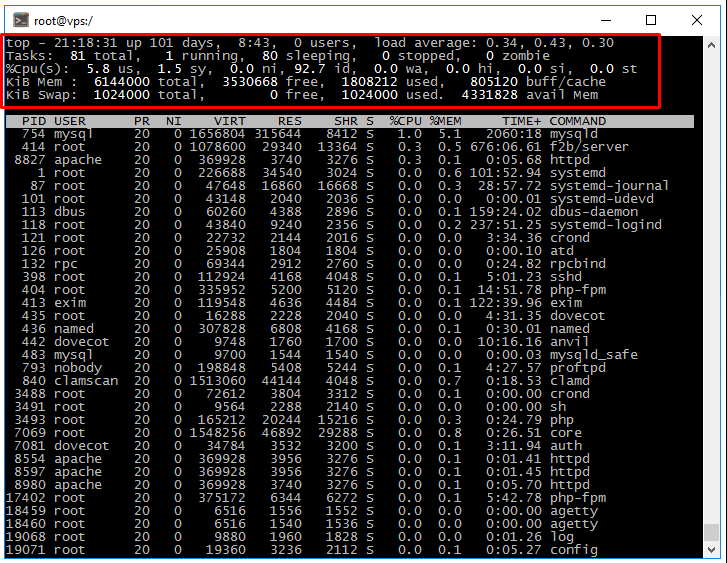
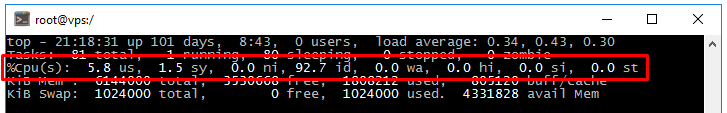
CPU parameter.
The CPU line shows several load parameters at once:
- us (user) - CPU usage by user processes.
- sy (system) - CPU usage by system processes.
- ni (nice) - CPU usage by priority changed processes using the "nice" command.
- id (idle) - CPU idle is free resources.
- wa (IO-wait) - reports I/O related downtime
- hi (hardware interrupts) - indicates the CPU time used to service the hardware interrupt.
- si (software interrupts) - indicates the CPU time used to service the software interrupt.
- st (stolen by the hypervisor) - indicates the CPU time used by the hypervisor.
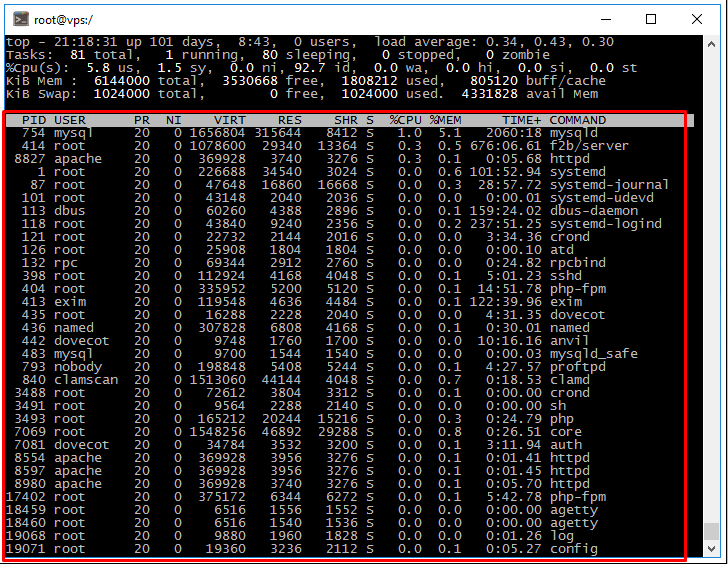
CPU load (parameters “sy”, “us”, “ni”).
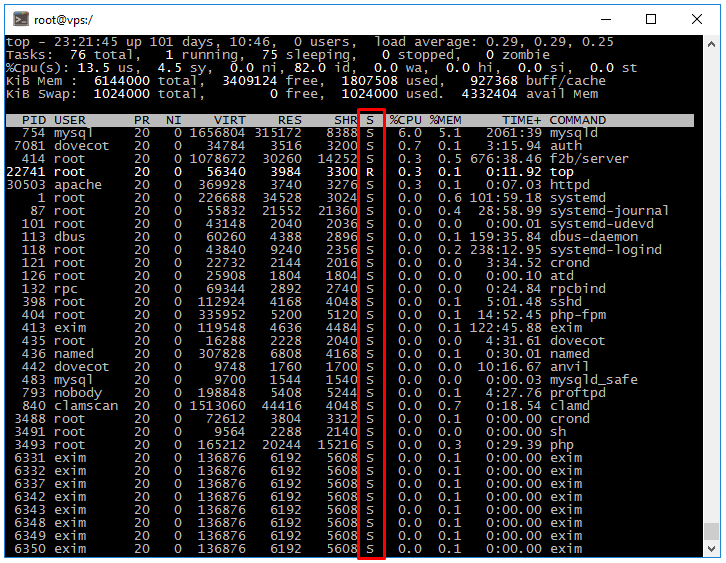
By the %CPU column in the output of the "top" command, you can see the processes and make optimizations if necessary. Or just add CPU power to the server.
I/O load ("wa" parameter).
High "wa" values, as well as high LA, indicate idle processes in the D-state due to disk subsystem or network problems.
Simplified state model in Linux.
D-state is a continuous sleep state (processes waiting for an I/O thread to become free).
R-state is the process is currently active (currently running).
S-state is the waiting state (sleeping). It is waiting for some event or signal.
Т-state is a process suspended by a STOP signal or by executing a trace.
Z-state is "zombie". A process that has terminated its execution but is present on the system to allow the parent process to read the exit code.
For a more detailed view, use the «ps aux» command.
Example: Investigating High «wa» and «Load Average» Issues
To find processes causing high «wa» (I/O wait) and Load Average, run the following command:
ps aux | grep D
This command displays processes in the D state (uninterruptible sleep), which typically indicates disk-related issues.